Change figure and axes background and foreground. See darkBackground_examples.mlx for a notebook of given examples.
Syntax
darkBackground()
darkBackground(Name, Value)
Description
A
darkBackground() updates figure properties to have black background and white foreground. example
B
darkBackground(Name, Value) updates figure properties to have black background and white foreground with additional options specified by one or more name-value pair arguments. For example, you can specify a different background color or foreground color. example
Examples
Example 1
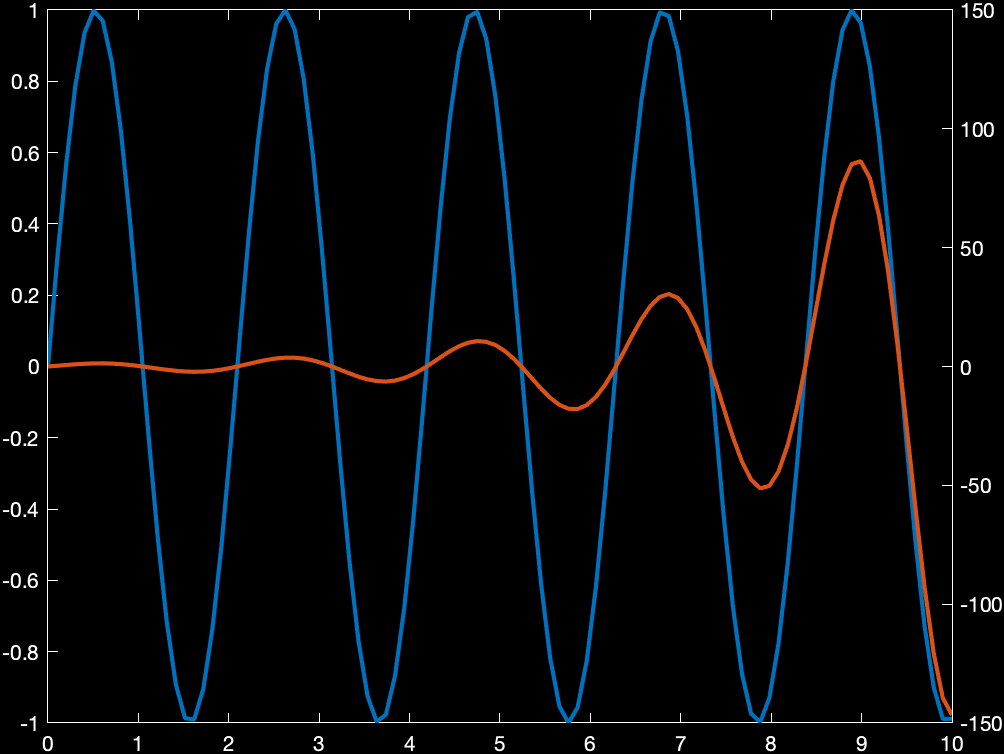
Copied code from MATLAB yyaxis function example (but give it a dark background).
x = linspace(0,10);
y = sin(3*x);
yyaxis left
plot(x,y)

z = sin(3*x).*exp(0.5*x);
yyaxis right
plot(x,z)
ylim([-150 150])

darkBackground()
Example 2
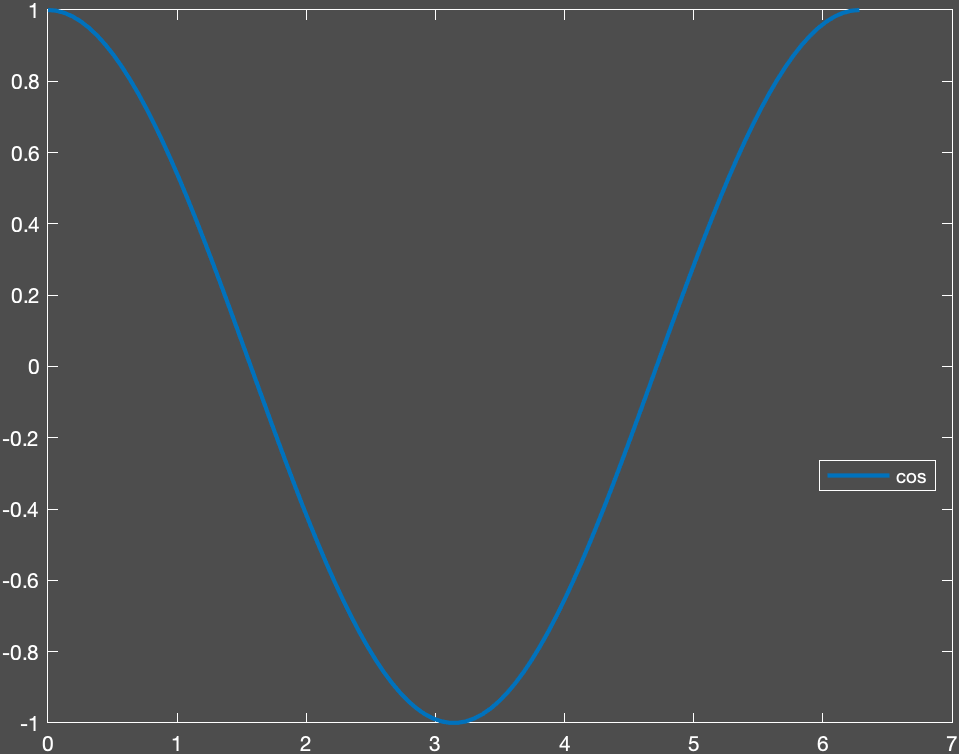
Change the background to gray instead of default black.
figure();
x = linspace(0,2*pi,100);
plot(x, cos(x), 'linewidth', 2, 'DisplayName','cos')
legend('location', 'best')

darkBackground("backColor", [0.3, 0.3, 0.3]); % gray background
Example 3
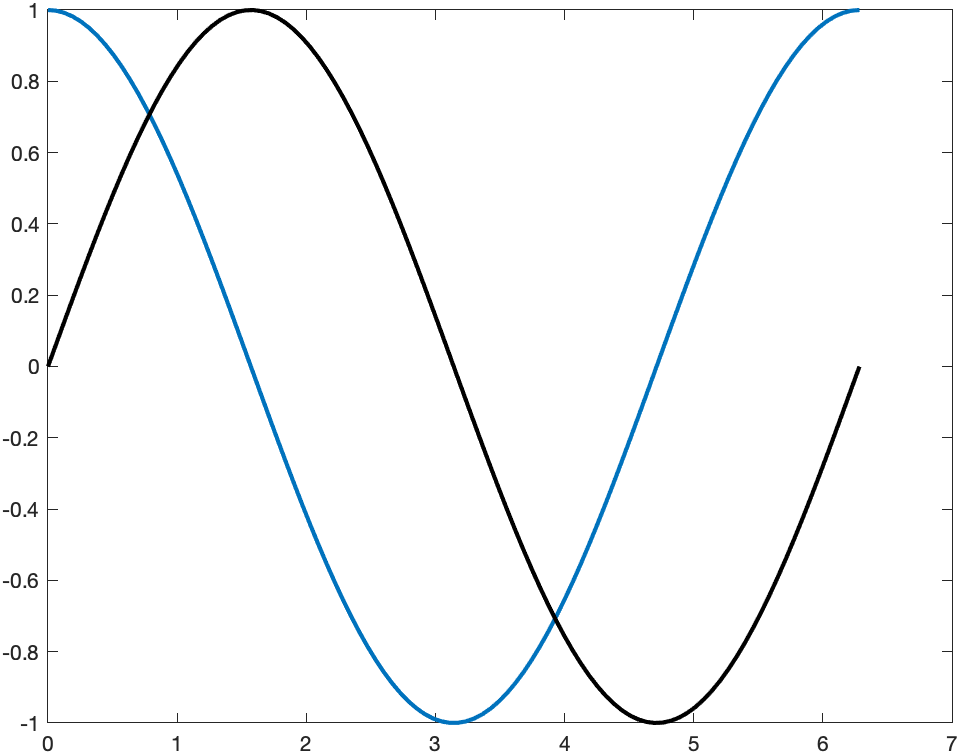
Plot high contrasting colors.
figure();
x = linspace(0,2*pi,100);
plot(x, cos(x), 'linewidth', 2);
hold on
plot(x, sin(x), 'k-', 'linewidth', 2); % black is the highest contrast object color for a white background
Name-Value Arguments
Specified optional comma-separated pairs of Name,Value arguments. Name is the is the argument name and Value is the corresponding value. Name musta ppear inside single or double quotes. You can specify several name and value pair arguments in any order as Name1,Value1,...,NameN,ValueN.
Example: 'backColor', [0.3,0.3,0.3], 'foreColor', [0,0,1] specifies a figure with gray background and blue foreground.
Figure handle (default=gcf())
Handle of figure you want to change to have specified background and foreground colors.
Data Types: (figure handle)
backColor
Background color (default=[0,0,0])
Background color to give figure and axes.
Data Types: (RGB triplet)
foreColor
Background color (default=[1,1,1])
Foreground color to give figure and axes.
Data Types: (RGB triplet)
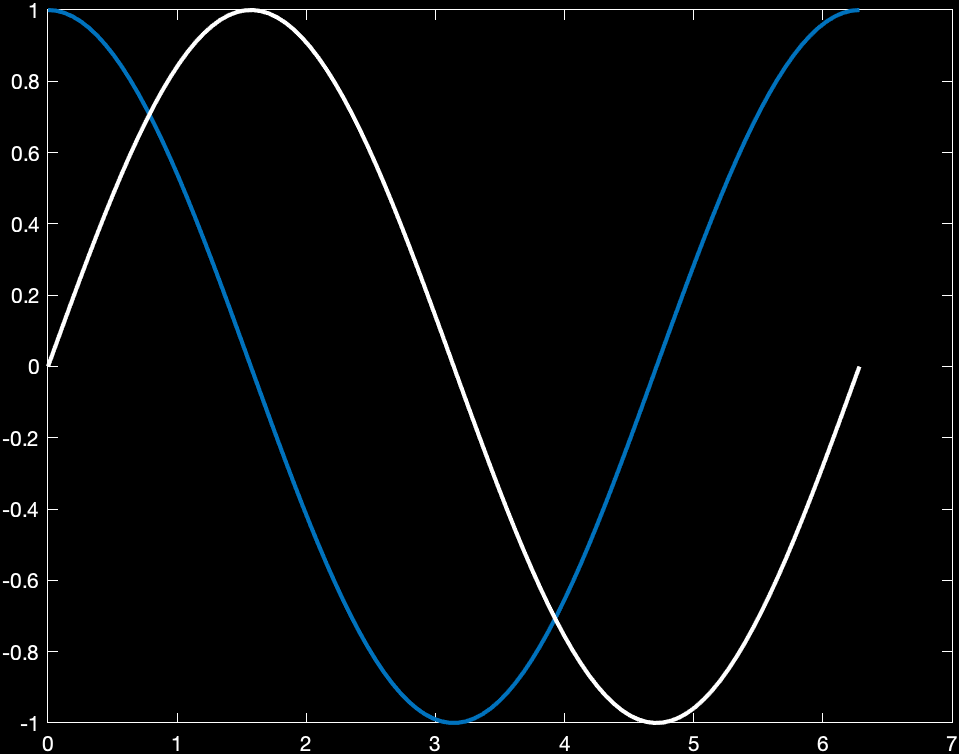
invert
Invert necessary colors (default=true)
Whether or not to invert necessary colors of figure. This argument will check to make sure that colors that are the same as the specified backColor are changed to specified foreColor. The assumptions is that if one plots an object with the highest contrast color, they will want that contrast to remain. See Example 3.
Data Types: (logical)
patchasBack
Invert the patch that is used as the axis background (default = false).
Some plotting functions use patch as the axis background. For these plot types, you need to specify this as true to get the “background” to be the correct color.
The following plotting functions use a patch as the background:
compass

ezpolar

waterfall
Data Types: (logical)
More About
This is a more comprehensive function based off of Elsa Birch’s function on MATLAB File Exchange.
Tips
It is best to call the function once the figure is finalized. If you add more objects to the figure, they will not be updated automatically. If you do add more objects to the figure after a function call, either call the function again or make sure your objects will appear with the new colors.
I would suggest adding both darkBackground.m and functionSignatures.json to a folder that is in your MATLAB path. The darkBackground.m contains the function and the functionSignatures.json will you give custom suggestions and code completion for when you call darkBackground in a script or notebook.
If you already have a functionSignatures.json file in your folder, just add the pertinent code to the original functionSignatures.json.
Issues and Discussion
Issues and Discussion.
If you don’t know how to use github (or don’t want to), just send me an email.