Take individual figures and put them together into one figure with multiple subplot. See iP2SP_examples.mlx for a notebook of given examples.
Syntax
individPlots2SubPlots(axS, subplotDim)
Description
A
individPlots2SubPlots(axS, subplotDim) returns one figure with subplots of dimesion subplotDim that contains axes defined in axS. example
Examples
Example 1
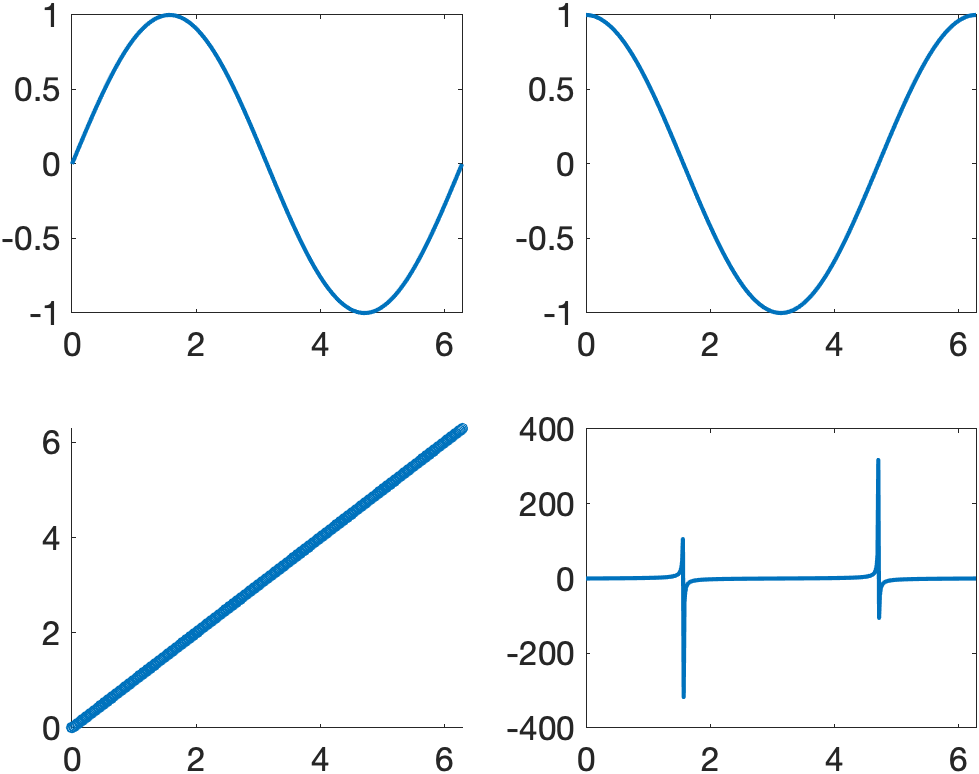
Generate four figures and put their contents into one figure with a 2x2 subplot layout.
% generate some data
x = linspace(0, 2*pi, 500);
figure();
ax(1) = gca();
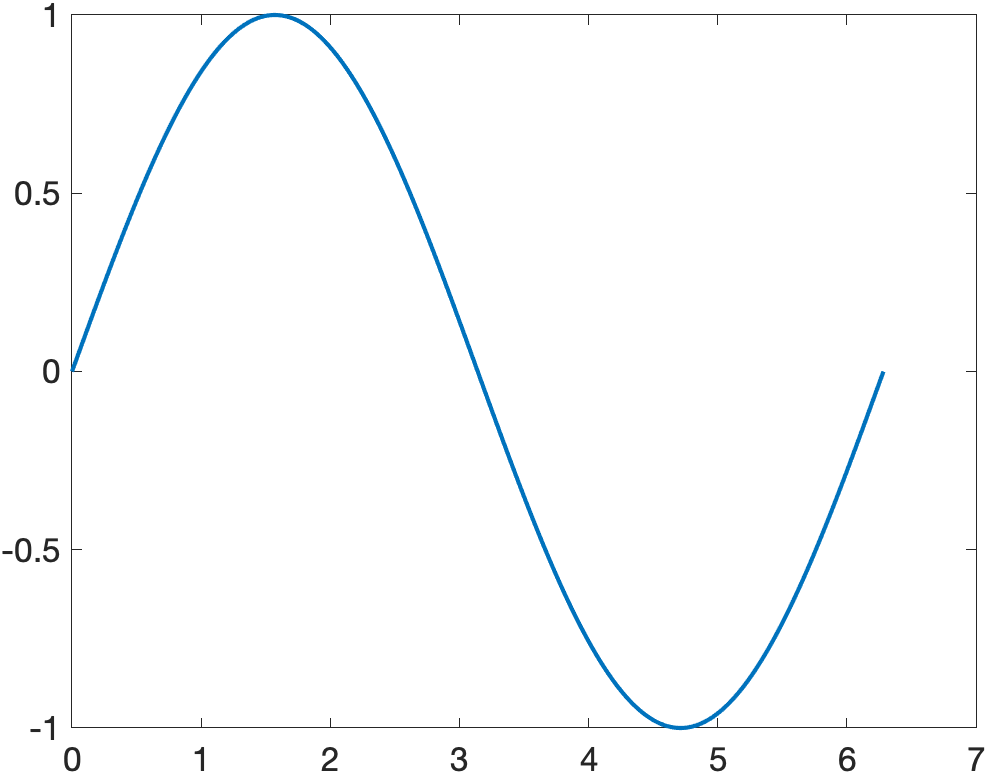
plot(x, sin(x), 'linewidth', 2)
set(ax(1),'fontsize', 16);
figure();
ax(2) = gca();
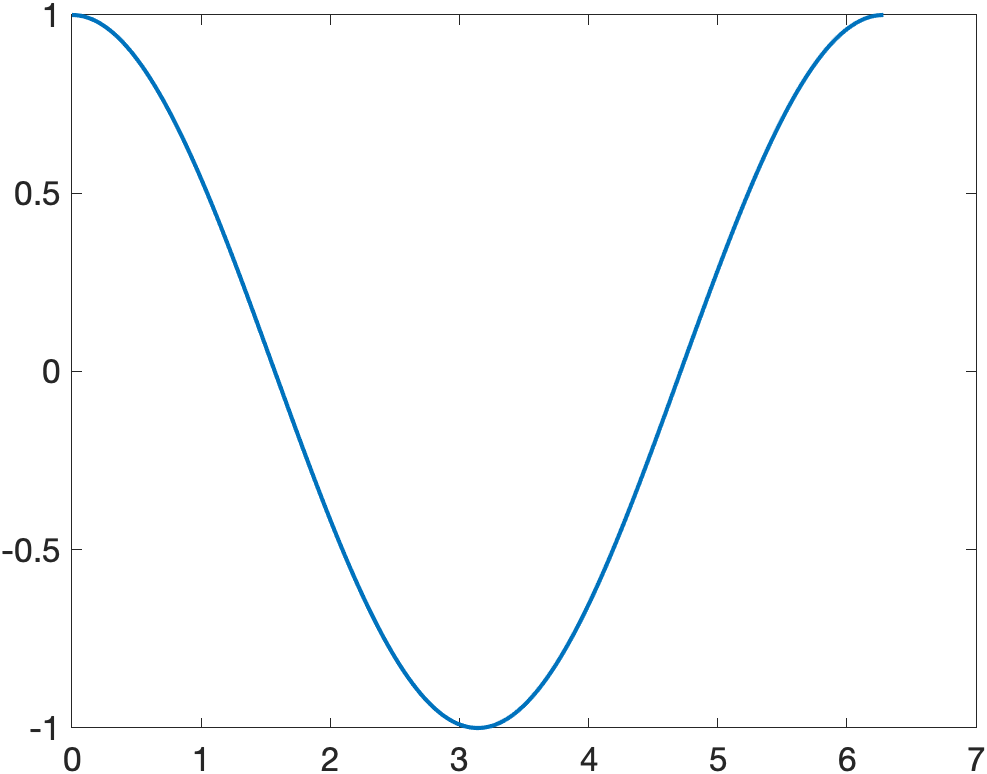
plot(x, cos(x), 'linewidth', 2)
set(ax(2), 'fontsize', 16);
figure();
ax(3) = gca();
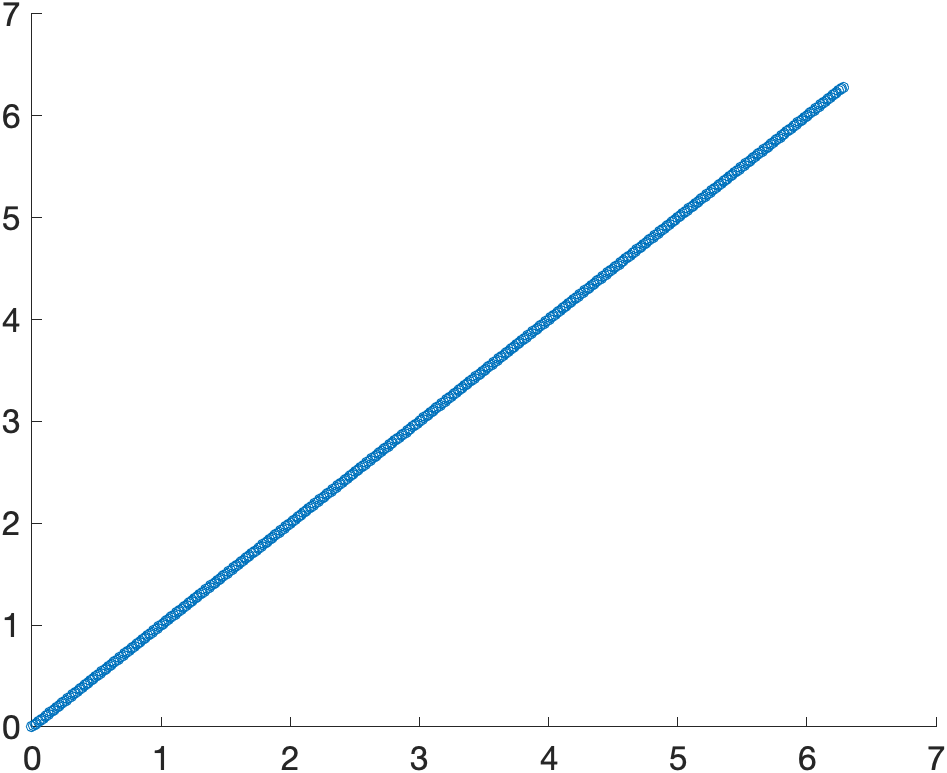
scatter(x, x, 25)
set(ax(3), 'fontsize', 16)
figure();
ax(4) = gca();
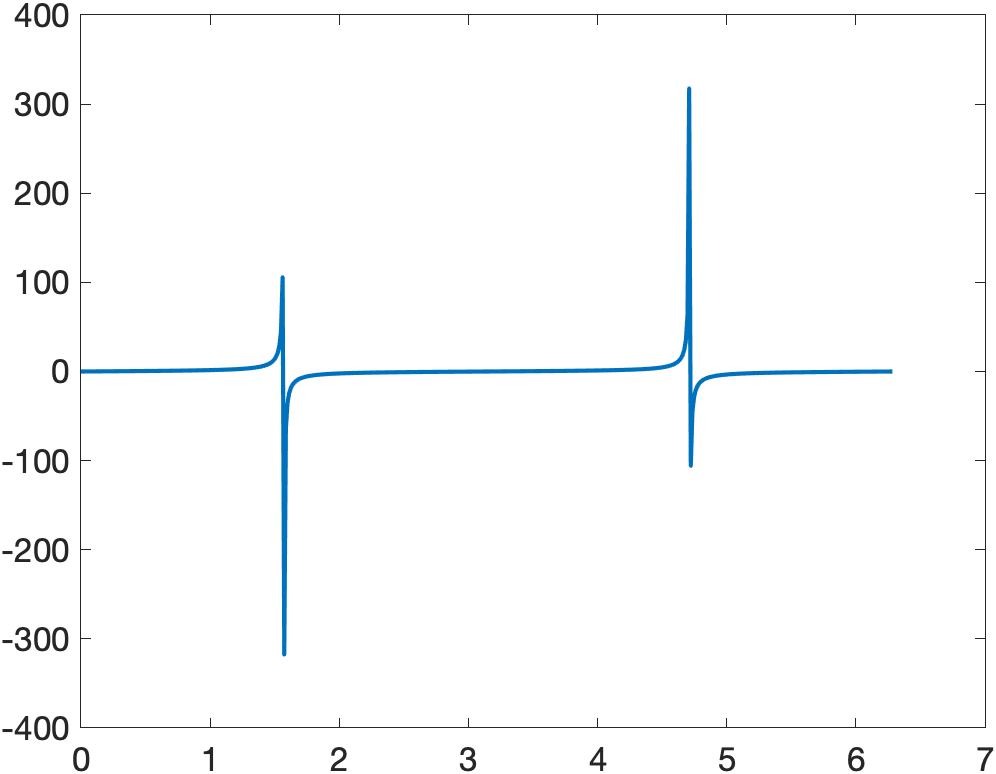
plot(x, tan(x), 'linewidth', 2)
set(ax(4), 'fontsize', 16)
individPlots2SubPlots(ax, [2,2])
Example 2
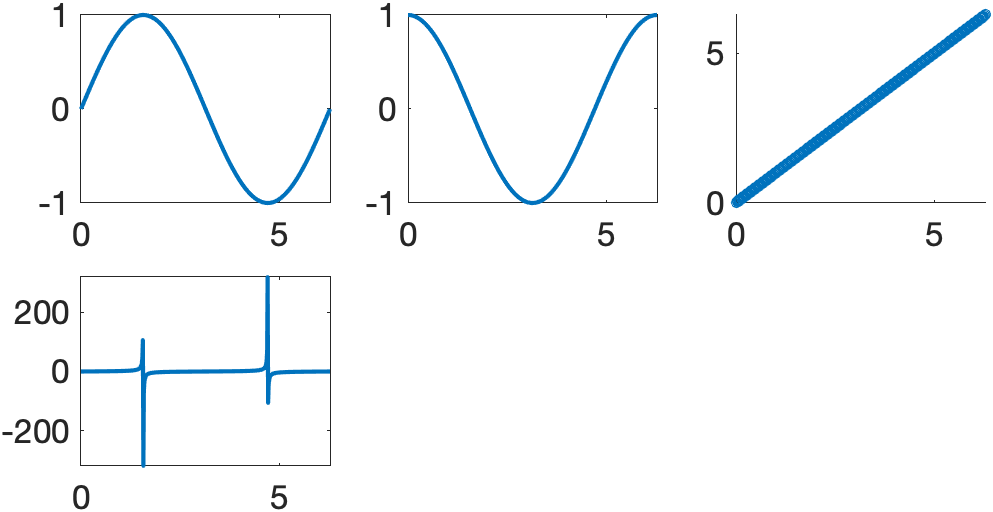
Generate four figures and put their contents into one figure with a 3x3 subplot layout.
% generate some data
x = linspace(0, 2*pi, 500);

figure();
ax(1) = gca();
plot(x, sin(x), 'linewidth', 2)
set(ax(1),'fontsize', 16);
figure();
ax(2) = gca();
plot(x, cos(x), 'linewidth', 2)
set(ax(2), 'fontsize', 16);
figure();
ax(3) = gca();
scatter(x, x, 25)
set(ax(3), 'fontsize', 16)
figure();
ax(4) = gca();
plot(x, tan(x), 'linewidth', 2)
set(ax(4), 'fontsize', 16)
individPlots2SubPlots(ax, [3,3])
axS
Vector of axes handles
1D vector that contains all axis handles to be plotted together.
Data Types: (vector, axes handles)
subplotDim
Subplot dimensions for final figure
Subplot layout for output figure.
Data Types: (vector, numeric)
More About
Tips
This is all this function does (a good function does 1 thing and 1 thing only). You can get the figure and axis after and edit the properties.
Issues and Discussion
Issues and Discussion.
If you don’t know how to use github (or don’t want to), just send me an email.