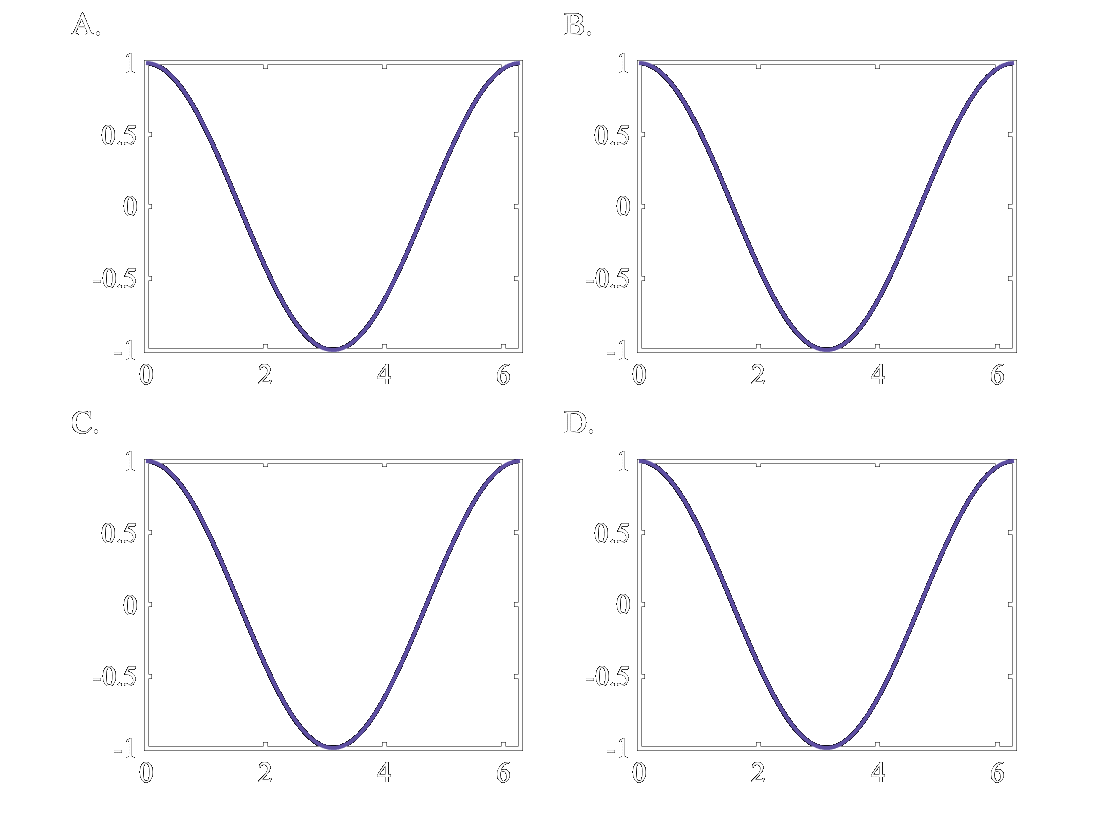
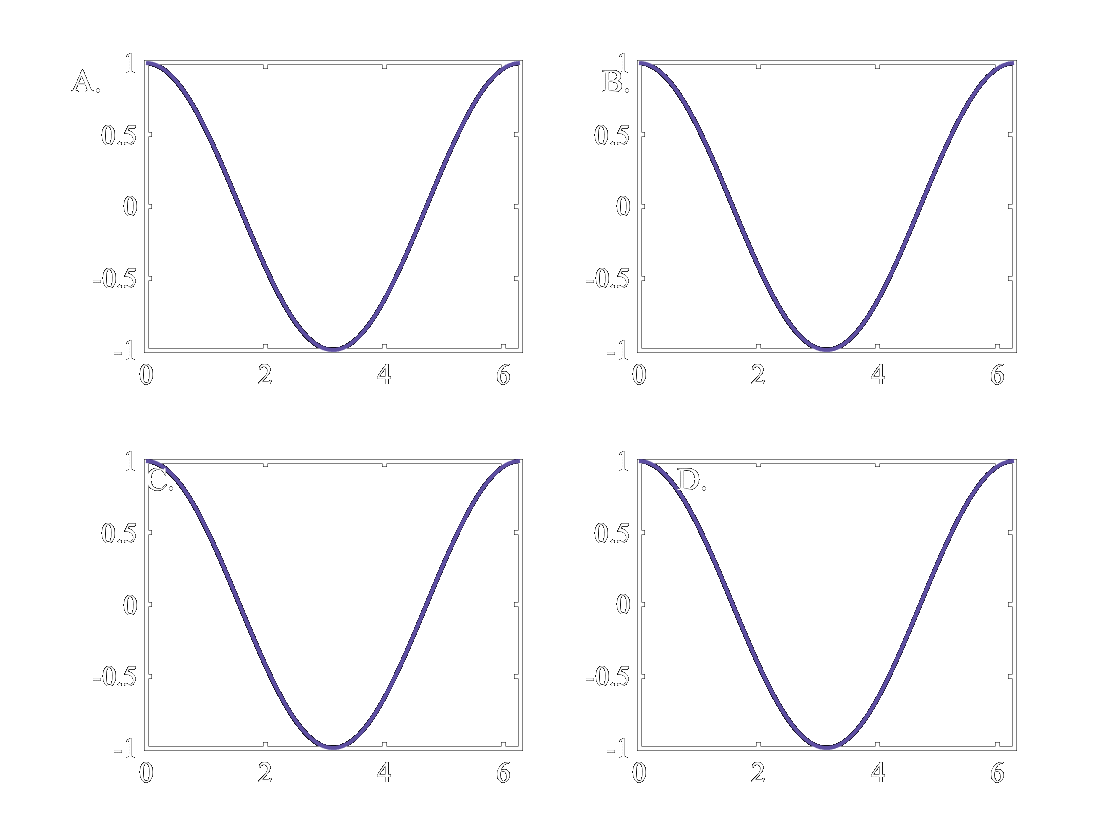
Assign a label to each of your subplots. See UsinglabelSubPlots.m for a script of examples.
Syntax
labelHandles = labelSubPlots(Name, Value)
Description
A
labelHandles = function(Name, Value) returns n text object with additional options specified by one or more name-value pair arguments. examples
Examples
Example 1
Create a 2x2 subplot figure with labels.
figure();
x=linspace(0,2*pi);
for i = 1:4
    subplot(2,2,i)
    plot(x,cos(x));
end
labelSubPlots();

Example 2
Create a 2x2 subplot figure with 3 axes and labels.
figure();
x=linspace(0,2*pi);
subplot(2,2,1)
plot(x,cos(x));
subplot(2,2,2)
plot(x,cos(x));
subplot(2,2,[3 4])
plot(x,cos(x));

labelSubPlots();

Example 3
Use number labels instead of default letters.
figure();
x=linspace(0,2*pi);
for i = 1:4
    subplot(2,2,i)
    plot(x,cos(x));
end
labelSubPlots('assignments', {'1' '2' '3' '4'});

Example 4
Change position of labels to be better.
figure();
x=linspace(0,2*pi);
for i = 1:4
    subplot(2,2,i)
    plot(x,cos(x));
end
labelSubPlots('assignPosX', -0.2, 'assignPosY', 1.2);

Exmaple 5
Lower the labels on the y-axis and have different x-axis positions for each subplot.
figure();
x=linspace(0,2*pi);
for i = 1:4
    subplot(2,2,i)
    plot(x,cos(x));
end
labelSubPlots('assignPosY', 1, 'assignPosX', -0.2:0.1:0.1);

Name-Value Arguments
Specified optional comma-separated pairs of Name,Value arguments. Name is the is the argument name and Value is the corresponding value. Name must appear inside single or double quotes. You can specify several name and value pair arguments in any order as Name1,Value1,...,NameN,ValueN.
Example: 'figH', gcf(), 'assignments', sprintf('%d', 1:4) specifies the current figure as the one to add numeric labels to.
figH
Figure handle (default=gcf())
Handle of the figure that has the subplots that get labeled.
Data Types: (figure handle)
assignments
Text to assign each subplot (default=’A’:char(‘A’+numAxes-1))
Cell array of label text. The function will iterate through this vector and assign it’s elements to the labels. The function also appends a ‘.’ after each element.
Data Types: (character array)
assignPosX
Text x position. (default=0.05)
X position of text in normalized units.
I take the conservative approach and default to values inside axes to allow users to have more control over code.
Data Types: (scalar, vector, numeric)
assignPosY
Text y position. (default=0.98)
Y position of text in normalized units.
I take the conservative approach and default to values inside axes to allow users to have more control over code.
Data Types: (scalar, vector, numeric)
Output
labelHandles
Text label handles.
Handles of text objects.
More About
This code is meant to be flexible and basic. I did not want to try to find best placements for all configurations, but allow users to have more control over where they add their labels.
Tips
I would suggest adding both labelSubPlots.m and functionSignatures.json to a folder that is in your MATLAB path. The labelSubPlots.m contains the function and the functionSignatures.json will you give custom suggestions and code completion for when you call labelSubPlots in a script or notebook.
If you already have a functionSignatures.json file in your folder, just add the pertinent code to the original functionSignatures.json.
Issues and Discussion
Issues and Discussion.
If you don’t know how to use github (or don’t want to), just send me an email.